
Hi,
I trained a simple multiclass model on the classic Iris dataset and I would like to plot its tree structure.
I never had issues using xgboost.plot_tree() with binary models, because XGBoost creates exactly the number of trees specified with n_estimators and each one contributes to the average final score used to classify a sample. With multiclass softmax output (3 classes in this case), XGBoost instead grows 3 trees for each boosting round to classify each class against the others.
The num_trees parameter is used to choose the tree to display, but in a multiclass scenario I noticed that it only displays trees for the first class. I used the m2cgen package to convert a XGBoost model to C code and I verified this behaviour with a simple 3-depth and 1-tree model.
This is the prediction code:
static void predict(double* input, double* output)
{
double var0;
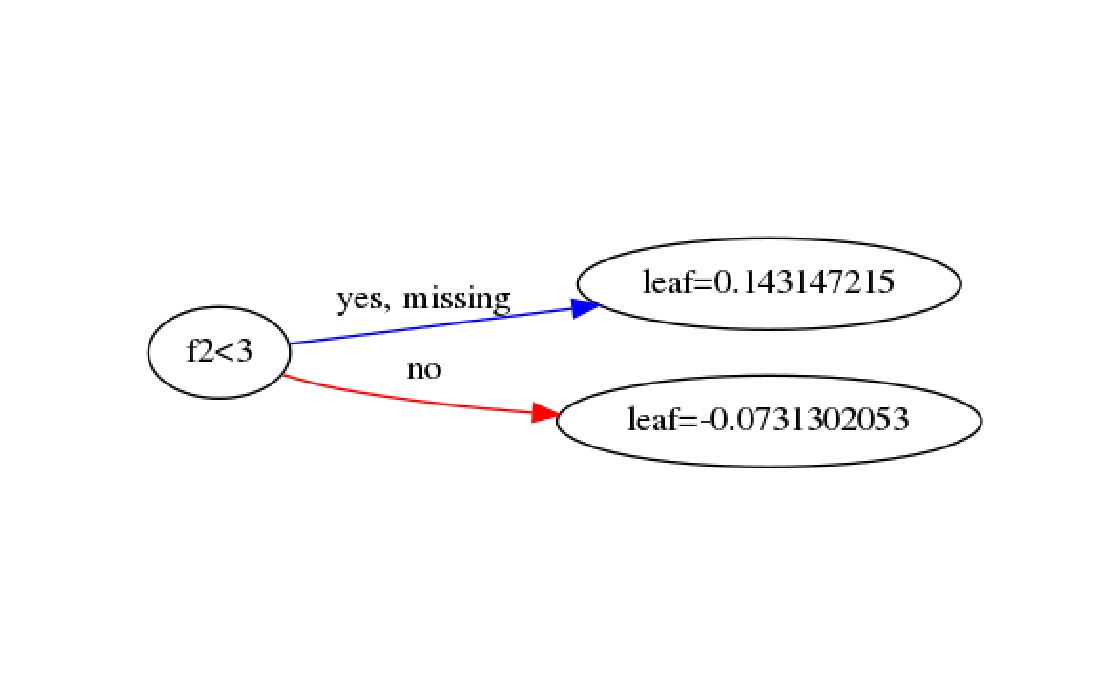
if ((input[2]) >= (3)) {
var0 = -0.0731302053;
} else {
var0 = 0.143147215;
}
double var1;
var1 = exp((0.5) + (var0));
double var2;
if ((input[2]) >= (3)) {
if ((input[3]) >= (1.79999995)) {
if ((input[2]) >= (4.9000001)) {
var2 = -0.0710059255;
} else {
var2 = -2.55448485e-09;
}
} else {
if ((input[2]) >= (5)) {
var2 = 0.0103448248;
} else {
var2 = 0.136686385;
}
}
} else {
var2 = -0.0715736076;
}
double var3;
var3 = exp((0.5) + (var2));
double var4;
if ((input[3]) >= (1.70000005)) {
var4 = 0.13333334;
} else {
if ((input[2]) >= (5)) {
var4 = 0.0599999987;
} else {
var4 = -0.0730878264;
}
}
double var5;
var5 = exp((0.5) + (var4));
double var6;
var6 = ((var1) + (var3)) + (var5);
memcpy(output, (double[]){(var1) / (var6), (var3) / (var6), (var5) / (var6)}, 3 * sizeof(double));
}
And this is the plotted tree (it corresponds to var0):
How can the other trees be plotted using xgboost.plot_tree()?
Any help is appreciated,
Thanks in advance