
I am training XGBoost models in an iterative way, where I train a couple of decision trees, pause, and then continue training. I noticed that my program had a memory leak in it and noticed quite high memory usage by XGBoost during my investigations. I’ve created a reproducible example below.
Data: https://www.openml.org/d/73 (~roughly 128 MB in memory (pandas), ~360 MB after one-hot encoding)
Code: https://gist.github.com/thuijskens/ae0c608af41a833f6d110da1e24ed2f5 (point the data file to wherever you store it).
Memory profiling the above example gives:
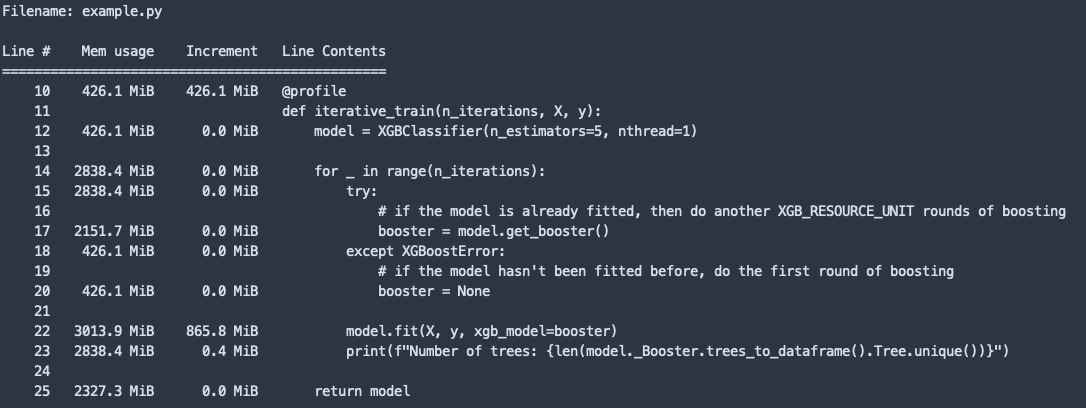
You can see the memory spikes dramatically, at some point consuming around 3 GB in total.
Running the above example, but setting n_iterations to 1 (so that no iterative fitting is done) results in a memory profile that “only” uses around 800 MB at the fit call (I’d show an image but I’m only allowed to display one image).
Why is the memory increasing so much with iterative fitting? I was wondering if this was related to the following sentence on the GPU support page:
If you train xgboost in a loop you may notice xgboost is not freeing device memory after each training iteration. This is because memory is allocated over the lifetime of the booster object and does not get freed until the booster is freed. A workaround is to serialise the booster object after training. See demo/gpu_acceleration/memory.py for a simple example.
Does this hold true for CPU training too?
In any case I find the memory usage very high, and similar experiments with LightGBM on the same data set give me memory consumptions that are 100x lower. Has anybody else run into similar observations?