ValueError: Must pass 2-d input when setting predict_contribs to True

Dear All,

I am trying to use predict_contribs=True within my XGBOOST Model. However, whenever I set it to True I do not get the probabilities out of the predict function and I get the following error.

My model parameters are as follows:
|–hyperparameters:
| |–tree_method: exact
| |–sampling: False
| |–n_iterations: 1
| |–batch_size: None
| |–seed: 42
| |–silent: 1
| |–nthread: 8
| |–num_boost_round: 320
| |–objective: multi:softprob
| |–reg_alpha: 0.8
| |–reg_lambda: 0.2
| |–colsample_bytree: 0.8
| |–eta: 0.05
| |–gamma: 0.1
| |–max_delta_step: 0.5
| |–min_child_weight: 1
| |–max_depth: 10
| |–scale_pos_weight: 1
| |–subsample: 0.5
| |–num_class: 2

@hcho3 Hi Philip, Any idea how to overcome this error? and why it occurs only when I set the predict_contrib to True!!

I don’t think this is issue with XGBoost at all. You are passing result of the prediction function Booster.predict() to pandas.DataFrame() constructor. This is an error because the prediction result is 1D array but DataFrame expects a 2D array.

You should store the result of the prediction function to an intermediate variable and use reshape() to re-shape it to 2D.

@hcho3 Well, what I can say right now that if the objective is multi:softprob as in my case the output of the predict function is a 2D array. But, when we set the predict_contrib to True the output is 1D not 2D(I think so).

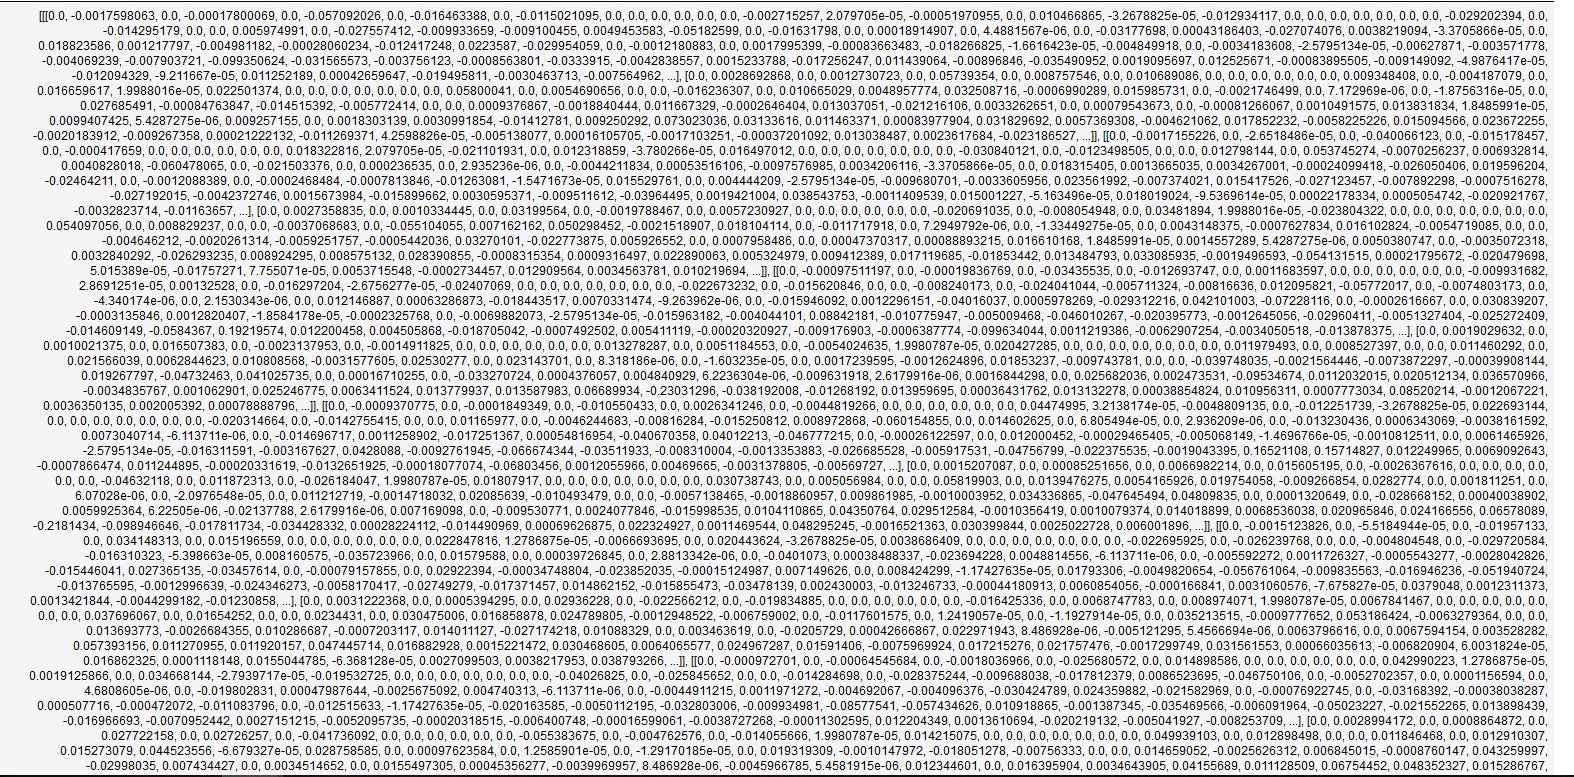
I got the results when I set the predict_contrib to True but I do not really understand the values. I think it is not a probability because I have a lot of negative values.

Can you give me a brief illustration of what exactly I get out when I set the predict_contrib to True?

Moreover, their sizes is extremely big. I have 19490872 rows. While, the data sent to the predict function were 40845 rows × 322 columns

when predict_contrib is set to True here’s the output:

It worth noting, that I listed the output of the model.predict to overcome the problem of the 2D issue. But, I want to know if I should have a 2D output from the model.predict, when the predict_contrib is set to True or not?

The SHAP prediction should be of dimension (nsample, nfeats + 1). I don’t know if SHAP works with multi-class classifier. In multi-class classifier, you get multiple outputs for each data row, one per class.

I got some results. I do not know if you can help me with that or not.

I have a 2 class classification problem. The data submitted to the predict function were of shape (28166,345).
The result I got out of the predict function were of shape (28166,2,346). I do not know if this correct because I have 2 class classification problem or that is actually an error and it should come out with a shape of (28166,346).

I understood now that the ‭19,490,872‬ rows I was getting before, were because I was applying flatten so It was the result of multiplying (28166 by 2 by 346).

Ah so for the multi-class setting the SHAP output is (nsample, num_class, nfeats+1).

That’s what I can interpret as well. However, I am not sure I was aiming to be assured with that from your side :grinning: :grinning:

Well I learned something today :slight_smile: Even though I am a maintainer, I don’t know all parts of the codebase equally.

But, do you think that the results are correct?

I think so, based on this line of code:

Yup, it’s clear now thanks a lot Philip :grinning: :grinning: :grinning: :grinning:.

I have one more question, but I do not really now if you can help me with that or not.

I see now that we have to split the shap_values for each class, and as well the expected_value of shap will be calculated for every class.

For example:
shap_output = model.predict(X, predict_contribs=True)
shap_values = shap_output[:, :-1] will be of shape (28166,1,346)
expected_value= shap_output[0, -1] will be of shape (346,)

I wonder then how can I submit these values to the plot functions of shap, such that each feature present it’s contribution for both classes.

I think shap_output[:, 0, :] captures the features’ contributions to prediction for the first class, and shap_output[:, 1, :] captures the features’ contributions to prediction for the second class.

As for SHAP plotting, I suggest that you raise questions at https://github.com/slundberg/shap/issues.

Yup, totally agree but then my question is still raised how to combine the contributions for each class.
So, I think I will go for a question on SHAP Github. I will notify you if I figured out how to solve this issue.

Thanks a lot Philip :grinning: :grinning:.