
I am very interested in the split details in xgboost, so I want to plot it.
I can easily plot the decision tree usingsklearn.tree.export_graphviz,
CODE:
    #jupyter notebook
    from sklearn.tree import export_graphviz
    from sklearn.tree import DecisionTreeRegressor
    import pydotplus
    from IPython .display import Image
    def print_graph(clf, feature_names):
        """Print decision tree."""
        graph = export_graphviz( clf,
                                label= "root" ,
                                proportion= True ,
                                impurity= False ,
                                out_file= None ,
                                feature_names=feature_names,
                                #class_names={ 0 : "D" , 1 : "R" },
                                filled= True ,
                                rounded= True )
        graph = pydotplus.graph_from_dot_data(graph)
        return Image (graph.create_png())

    from sklearn.datasets import load_boston
    d = load_boston()

    dtr = DecisionTreeRegressor()

    dtr.fit(pd.DataFrame(d['data'][:10,:10],columns=d['feature_names'][:10]),d['target'][:10])

    print_graph(dtr,d['feature_names'][:10])
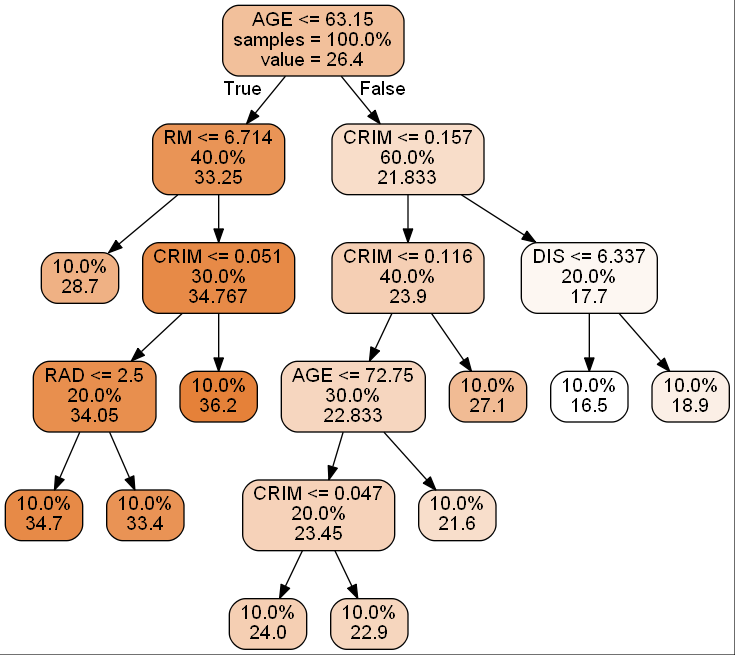
as you can see, in the plot, every split node has 3 values: split condition, sample rate, regresion value.
When I use
xgb.to_graphviz(clf) to plot the tree in xgboost model, I get this picture.#xgbTree|657x500#
I can’t find the sample data amount in the split, after reading the xgb.to_graphviz source code, I know it use
booster.get_dump to get split condition, however , this function still cannot get the explicit information in every split.as the issue Add parameters to the plotting function to control the node shape
Can you help me? how can I plot the xgboost tree as in sklearn ?
Thanks a lot!