
Hello Everyone,
I am new in xgboost. I am building survival model. When I get score with output_margin = False, all scores are between (0, 1). and when I get score with output_margin = True, I get all score below 0. I though since it is hazard ratio, range should be between (0, inf) if output_margin is False. And (-inf, inf) if we use output_margin = True.
If not case. how do I interpreter data?
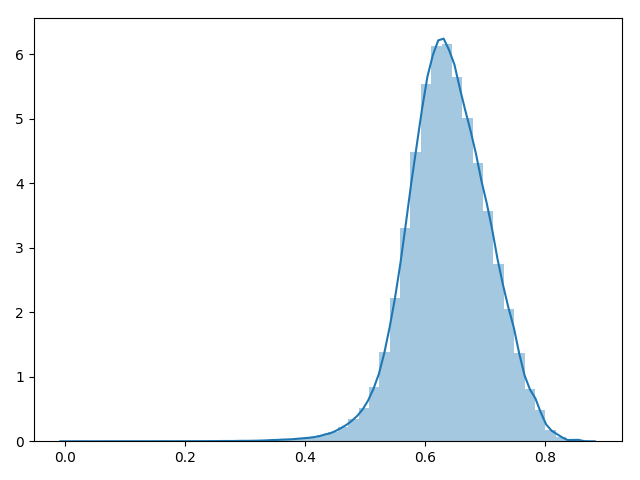
Following image is density plot when output_margin is False
From,
Kush Patel