Hello,
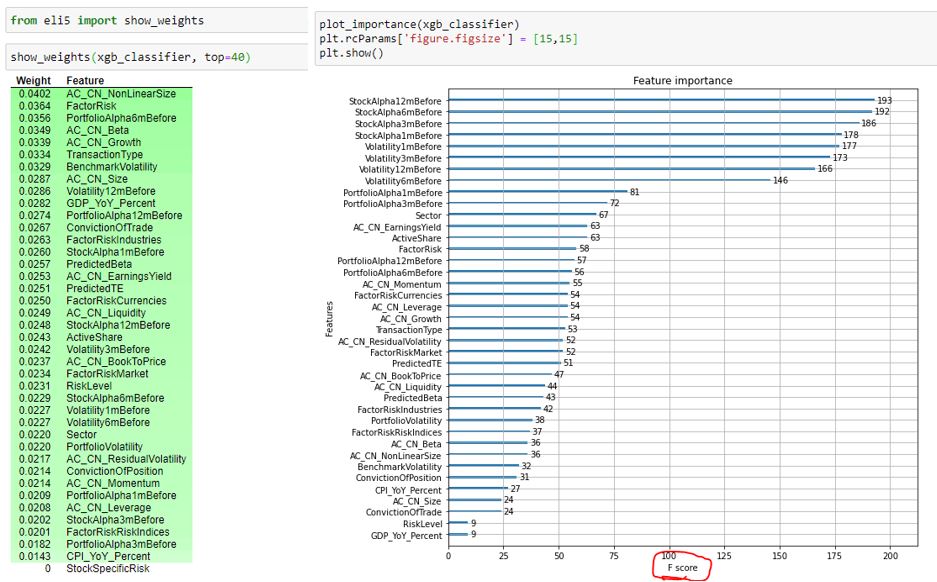
I am relative a new user in Machine Learning and XGB. I have run an xgb classifier and want to analyze the model output. One thing that i am struggling to understand is what the plot_importance chart shows and why it’s telling a different story from the features_importance.
Additionaly, the plot_importance seems to have an axis labeled ‘F score’ which i am not sure what exactly is that it represents (F-Score ranges from 0 to 1 isn’t it?).
If you can see from the two charts, some variables seem important in the ‘plot_importance’ i.e. the appear at the top however, they have smaller weight than others in the ‘features_importance’. That part I dont understand. Appreciate if someone can explain it a bit. Thanks in advance.
See below the two charts: