
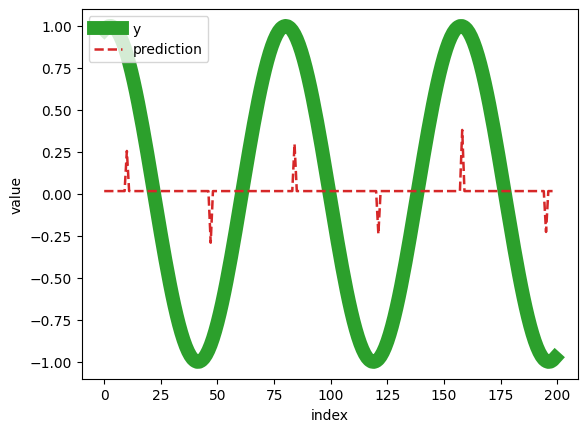
Yesterday I encountered a problem where I couldn’t train an XGBoostRegressor on my data using valid parameters. I created a question about it, and I was provided with code that worked for the respondent. After running the code on my machine, I obtained the following result:
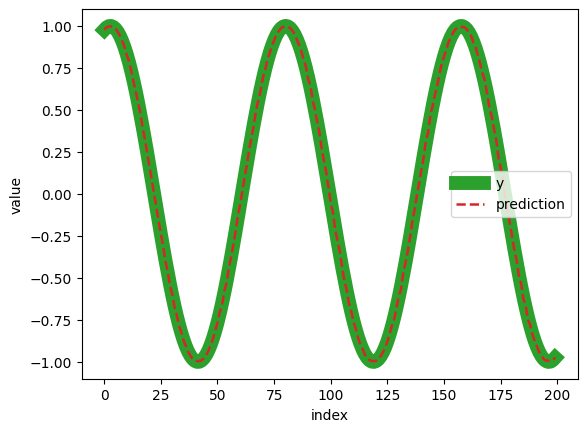
Here’s the result that the person who wrote the code obtained:
After trying several Python versions, I couldn’t achieve the same result on my machines. The only place I got a similar result was on Google Colab, which leads me to think that the issue is likely with the operating system. I need to somehow modify the code to get the correct result:
Windows 11:
- 3.8.10 - failure
- 3.11.4 - failure
- 3.10.11 - failure
Windows 10:
- 3.10.5 - failure
Google Colab (Unix):
- 3.10.12 - success
If you know how to rewrite this code to make it work on Windows, I would greatly appreciate your assistance.
Source code:
import pandas as pd
import numpy as np
import matplotlib.pyplot as plt
from sklearn.model_selection import GridSearchCV, RandomizedSearchCV, KFold
from xgboost import XGBRegressor

start_date = '2010-01-01'
end_date = '2020-01-01'
dates = pd.date_range(start=start_date, end=end_date, freq='D')
unix_dates = np.array([int(pd.Timestamp(d).timestamp()) for d in dates])
freq = 'D'  # Monthly frequency
date_rng = pd.date_range(start=start_date, end=end_date, freq=freq)
prices = np.sin(unix_dates)
data = pd.DataFrame({'ds': date_rng, 'y': prices})

params = {
    'max_depth': [3, 6, 12],
    'learning_rate': [0.001, 0.01, 0.3],
    'n_estimators': [1, 10, 50, 500],
}

model = XGBRegressor(random_state=0)
model.get_params()

#Prepare data for algorithm by
# converting datetime to a numeric format
X = data[['ds']].values.astype(int)
y = data.y.values

search = GridSearchCV(
    model,
    params,
    n_jobs=-1,
    cv=KFold(n_splits=3, shuffle=True, random_state=0), #with shuffling
    return_train_score=True,
    scoring='neg_mean_absolute_error',
    verbose=0,
).fit(X, y)

cv_results = search.cv_results_

#View the CV results (sorted by test_score)
results_df = (
    pd.DataFrame(cv_results)
    .eval('mean_test_score = -mean_test_score')
    .sort_values('mean_test_score')
)
display(results_df.head(3))

#Get prediction using the best estimator
predictions = search.best_estimator_.predict(X)

#View the first 100 samples
plt.plot(y[:200], linewidth=10, color='tab:green', label='y')
plt.plot(predictions[:200], color='tab:red', linestyle='--', linewidth=1.8, label='prediction')
plt.legend()
plt.xlabel('index')
plt.ylabel('value')